

A Future Matrix portlet can hold the whole workshop: Factor Analysis, Future Stories, Planned Actions, Measures of Performance, Future trajectory and Operational Tracking. Here is how the six sections fit together in the fictional Harbour Energy example.
The Future Matrix was created by Julio Graham, who operates Olive Professional Services.
Give the workshop its own context
The module behind The Future Matrix is Factor Future Contingency. A new portlet gives you an independent working instance. Name it for the subject of the workshop so participants can distinguish it from other matrices.
An owner or administrator can maintain the portlet’s configuration markdown. Record the purpose, audience and decision being considered there. Quadrant Guidance sections can supply context-specific guidance for the control and impact combinations.
Search Add Portlet for Factor Future Contingency. Give each workshop a separate portlet so its factors, stories, response rules and captures have their own saved state.
Collect and rate the factors
The Factor Analysis workshop is where you add factors and arrange them. Keep the initial titles short enough to discuss and recognise on the matrix.
- Open the portlet and choose Workshop Factor Analysis.
- Use Add Factor for an individual item, or Bulk Add for a prepared list.
- Rate control and impact separately on the seven-point scales. A rating of four sits on the dimension line.
- Use Group Factors for related items. Switch to the matrix to position factor groups by control and impact.
- Exit the workshop and use the quadrant filter to review the relevant factor groups.
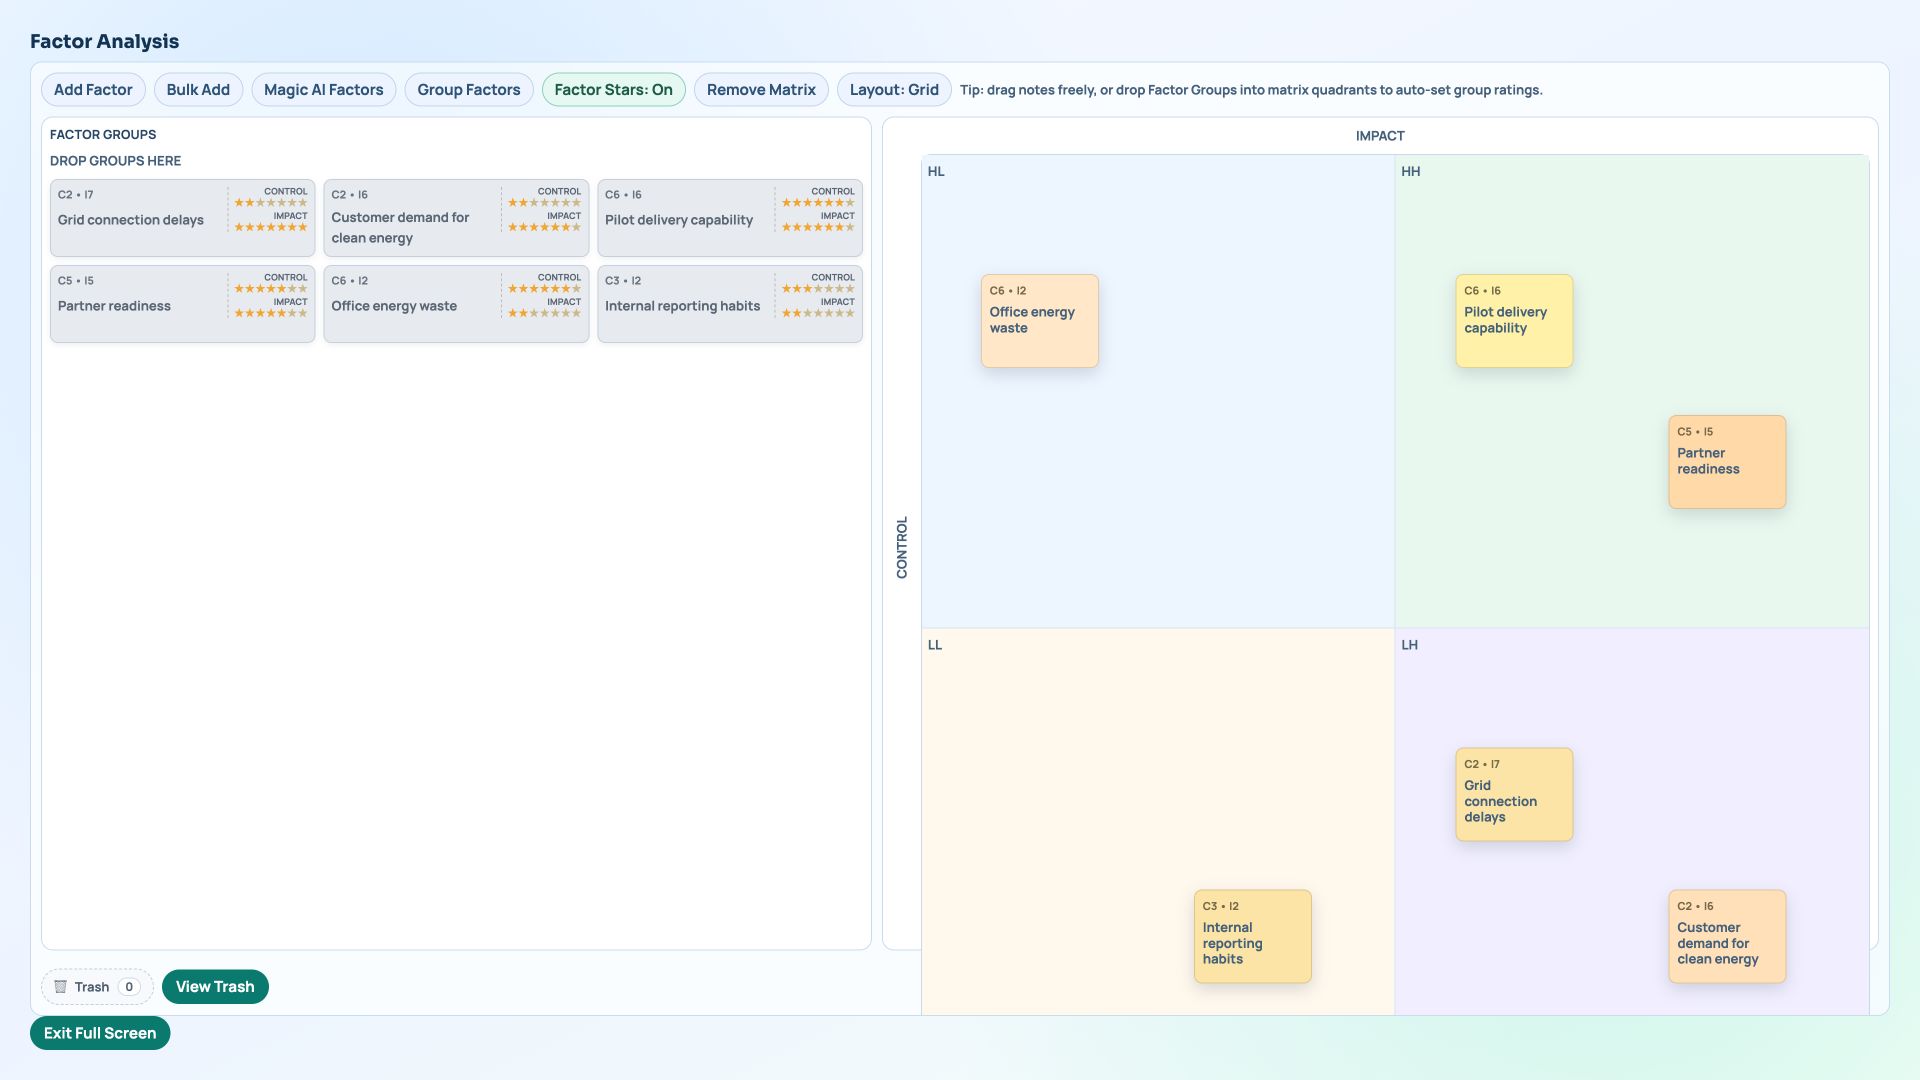
Example: two different responses
In the demo, Pilot delivery capability has high control and high impact. Grid connection delays has low control and high impact. The first can lead to an agreed preparation task; the second needs discussion of alternative conditions and possible responses.
Ask participants to explain the ratings before moving on. A disagreement about control often points to a different assumption about the organisation’s authority or its dependencies.
Develop the four Future Stories
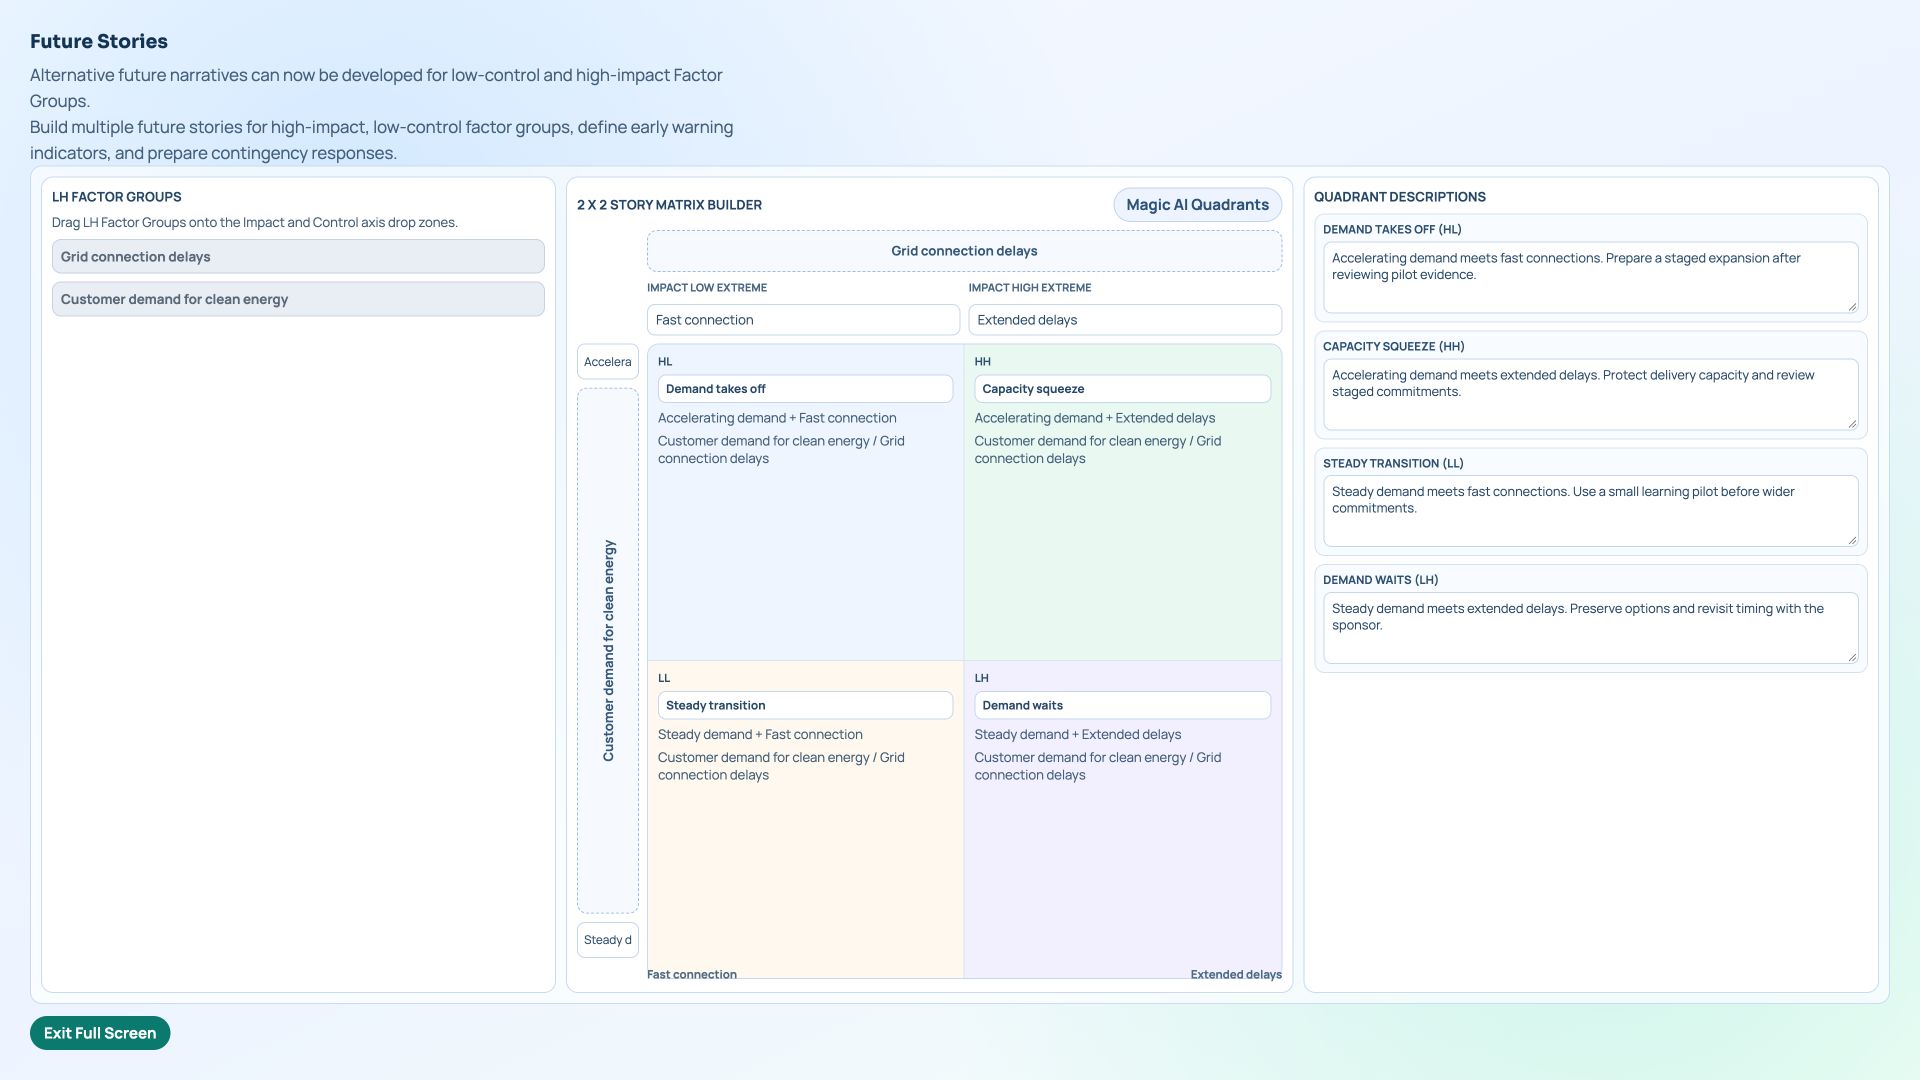
Select LH, the low-control/high-impact filter, then choose Workshop Future Stories. Place relevant factor groups on the two story axes and enter their extremes. These axes describe alternative conditions; the initial control and impact ratings decide which factors are worth exploring.
The demo uses fast connection versus extended delays, and steady versus accelerating customer demand. Name all four combinations and write a short description of what each would mean for the same pilot. This gives the next discussion a shared reference.
Prepare responses in Planned Actions
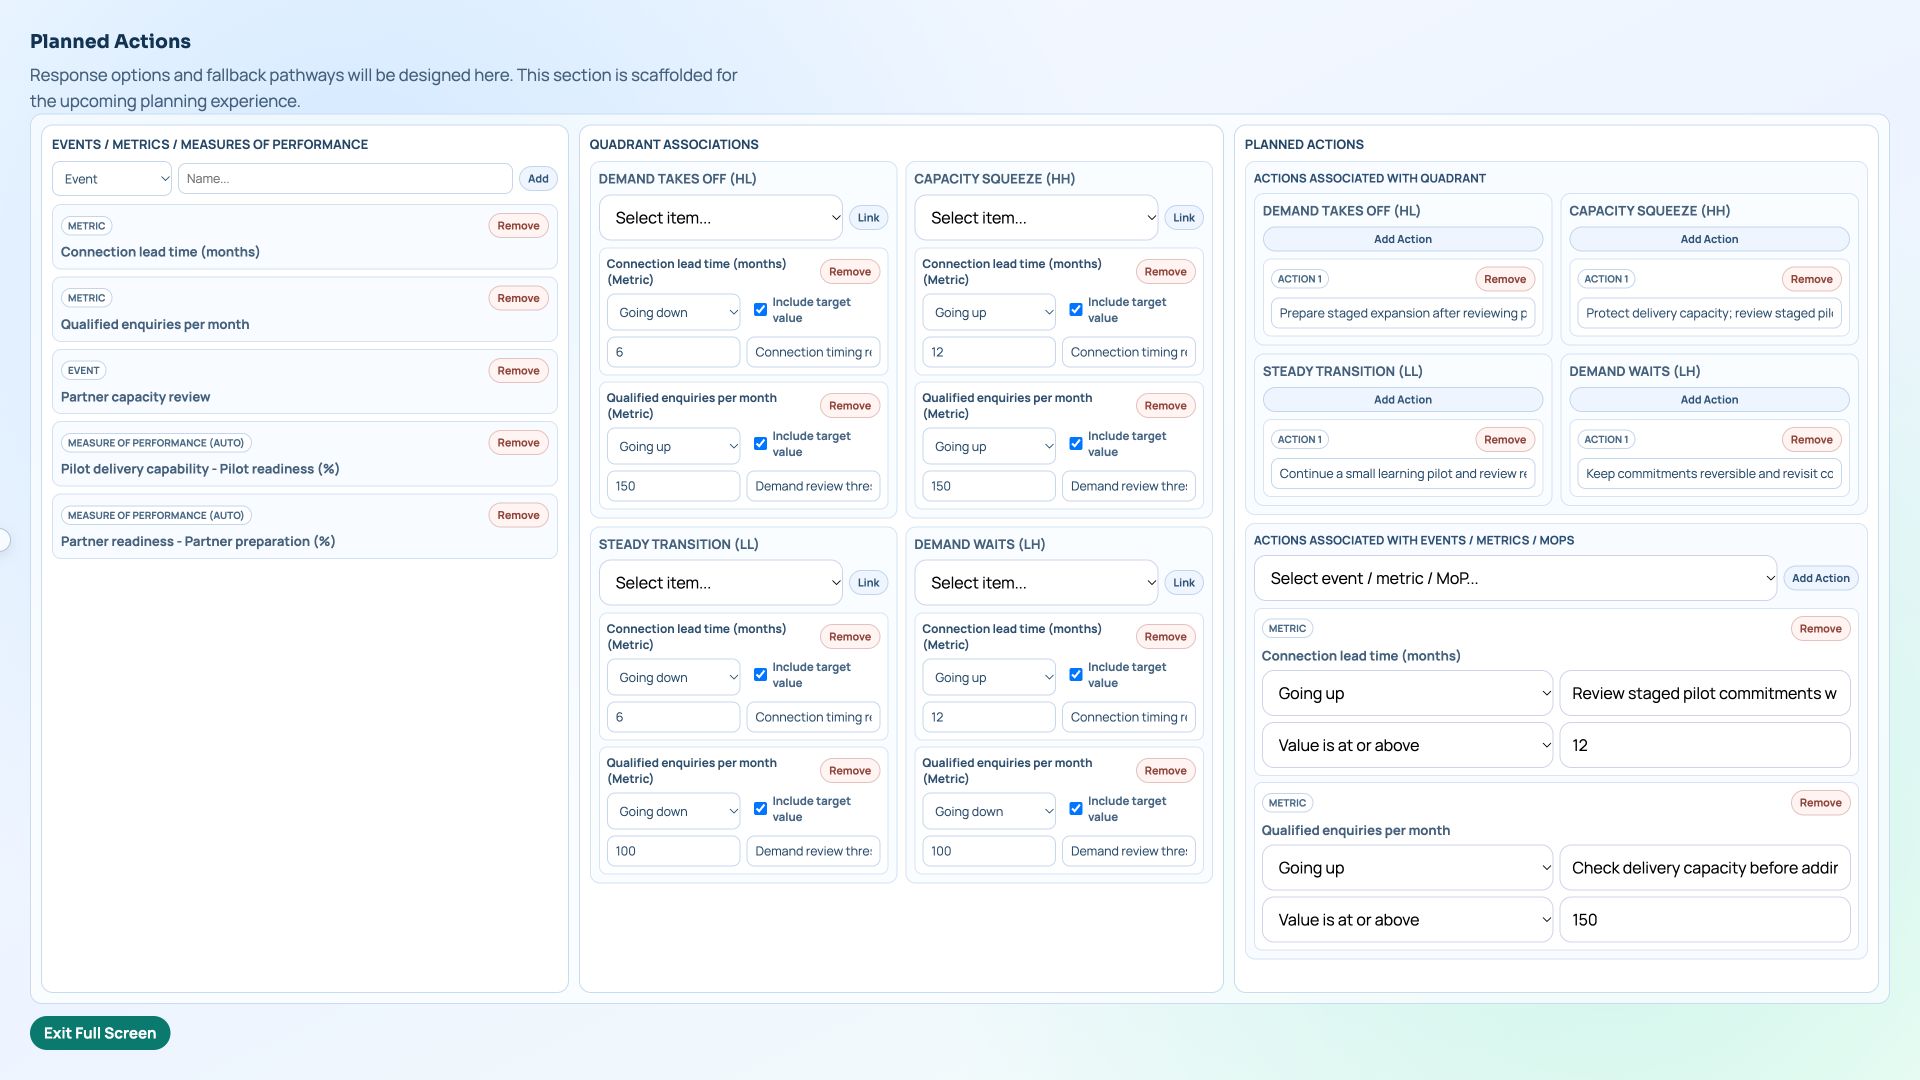
Open Workshop Planned Actions for the populated planning workspace. Add events, metrics or measures, link them to a story under Quadrant Associations, and specify the relevant direction and optional target. Record a response for each story and, where useful, an action associated with an individual signal.
For example, the demo associates Capacity squeeze with rising connection lead time and enquiries. Its proposed response is to protect delivery capacity and review staged commitments. An individual review rule uses a connection lead time at or above twelve months. These are fictional discussion thresholds; actions remain proposals for the team to review. The compact dashboard preview is still a placeholder, so use the workshop to inspect the actual entries.
Define Measures of Performance
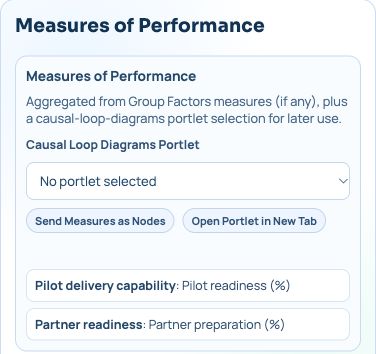
In Factor Analysis, open Group Factors and add measures to the relevant group. Pilot delivery capability has Pilot readiness (%); Partner readiness has Partner preparation (%). The Measures of Performance section brings these together, and they also become available in Planned Actions and Operational Tracking.
The section also offers a Causal Loop Diagrams portlet selector and Send Measures as Nodes. If using that hand-off, choose an appropriate portlet you can edit and check the receiving model. This demo leaves the selector empty and does not demonstrate that transfer.
Capture values, then review the future trajectory
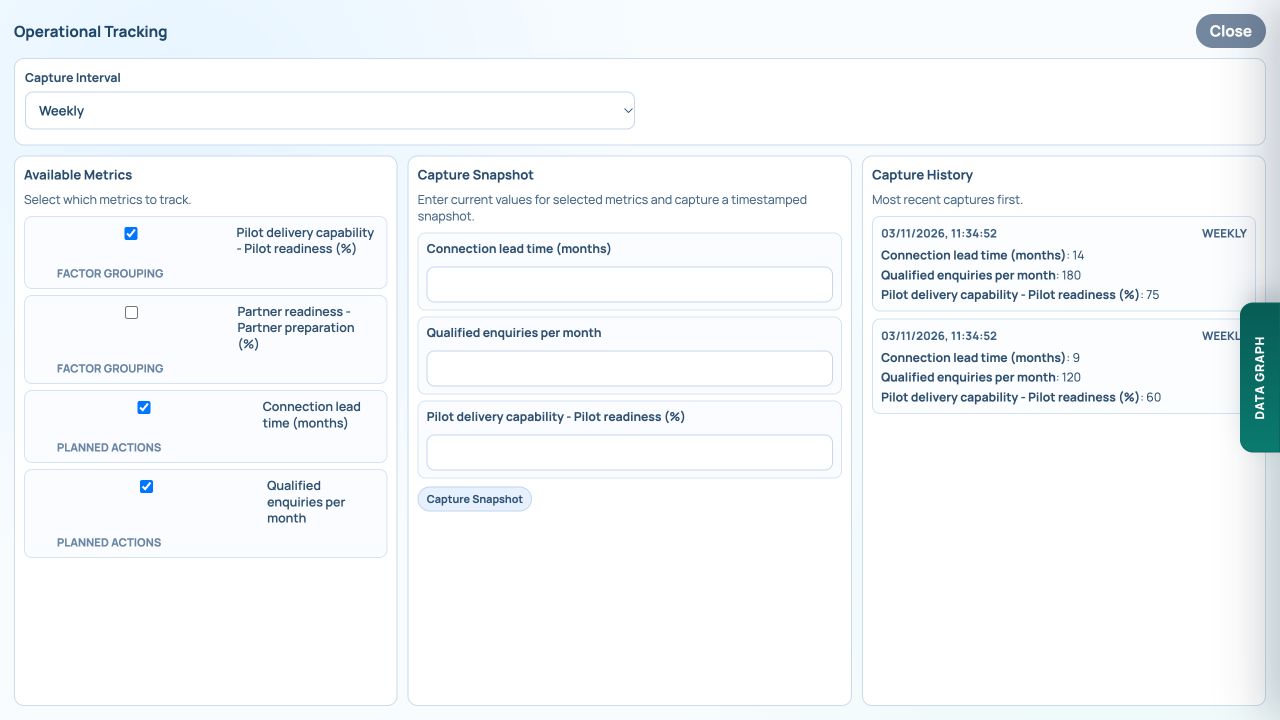
Open Operational Tracking, choose the metrics to monitor and set the capture interval. Enter the current values and choose Capture Snapshot. In this example, connection lead time, enquiries and pilot readiness are selected. Captures are manual; choosing Weekly does not connect a data feed or start an automatic capture schedule.
Open Future Tragectory Workshop — the current button uses that spelling — to inspect how the latest captured signals match each story. The two demo captures provide a change in direction as well as current values. Read the explanation behind each affinity score; a high percentage is not a forecast or likelihood.
Revisit the planned response with participants before changing commitments. Export the JSON state for reference when needed.
Try it in your workspace
In a separate Factor Future Contingency portlet, develop one story, add a response and a measure, then capture two sample values and inspect the trajectory explanation.
Demo notes and files
The screenshots use the private CEP Blog · Field Notes workspace. The notes below identify the example portlets and downloadable files. Use your own permitted portlets to follow the steps.
See the demo notes ↗This is part of an editorial retrospective. The archive date is not a feature release date; descriptions and screenshots reflect the November 2026 local demonstration. The examples are fictional.